Home Office
Introduction
Lorem ipsum dolor sit amet, consetetur sadipscing elitr, sed diam nonumy eirmod tempor invidunt ut labore et dolore magna aliquyam erat, sed diam voluptua. At vero eos et accusam et justo duo dolores et ea rebum. Stet clita kasd gubergren, no sea takimata sanctus est Lorem ipsum dolor sit amet. Lorem ipsum dolor sit amet, consetetur sadipscing elitr, sed diam nonumy eirmod tempor invidunt ut labore et dolore magna aliquyam erat, sed diam voluptua. At vero eos et accusam et justo duo dolores et ea rebum. Stet clita kasd gubergren, no sea takimata sanctus est Lorem ipsum dolor sit amet.
Average time spent in Home Office
In December of 2019, when the coronavirus was just one of many news stories from abroad, we coincidentally asked the participants of our study: “What percentage of Your worktime do You work from home (Home Office)?”
The following graphs show the average proportion of time spent in Home Office and how the percentages were distributed back then.
home_office_T1 = data.frame(
  label = c("In Home Office", "Out of Home Office"),
  Percent = round(c(mean(data_HO$T1_home_office, na.rm = T),100-mean(data_HO$T1_home_office, na.rm = T)), digits = 2)
)
home_office_T1 <- home_office_T1 %>%
  arrange(desc(label)) %>%
  mutate(prop = Percent / sum(home_office_T1$Percent) *100) %>%
  mutate(ypos = cumsum(prop)- 0.5*prop )

home_office_T1$ypos = c(44.2,92.5)

mean_HO_T1 = ggplot(home_office_T1, aes(x="", y=Percent, fill = label))+
  geom_bar(width = 1, stat = "identity", color = "white", alpha = .9) +
  scale_fill_manual(values = c("darkslategray1","dodgerblue1"))+
  coord_polar("y", direction = -1)+
  geom_text(aes(y = ypos, label = paste0(Percent, '%')), color = "grey32", size=6) +
  guides(fill=guide_legend(title="Average proportion of worktime spent...", title.position = "top"))+
  theme_void()+
  theme(legend.position="bottom", legend.text = element_text(size = 14), legend.title = element_text(size = 14.5) )


mean_HO_T1

density_HO_T1 = ggplot(data_HO, aes(T1_home_office))+
  theme_classic()+
  geom_histogram(binwidth=10,col="dodgerblue2", fill = "dodgerblue", alpha = .4)+
  geom_vline(aes(xintercept=mean(T1_home_office, na.rm=T)), linetype="dashed", size= 0.5)+
  labs(x="Percentage of worktime spent in Home Office", y = "Amount of participants")+
  scale_x_continuous(breaks = seq(0,100,10), labels = paste0(seq(0,100,10), '%')) +
  scale_y_continuous(breaks=seq(0, 1500, 250))+
  theme(axis.text=element_text(size=12), axis.title = element_text(size = 14))

density_HO_T1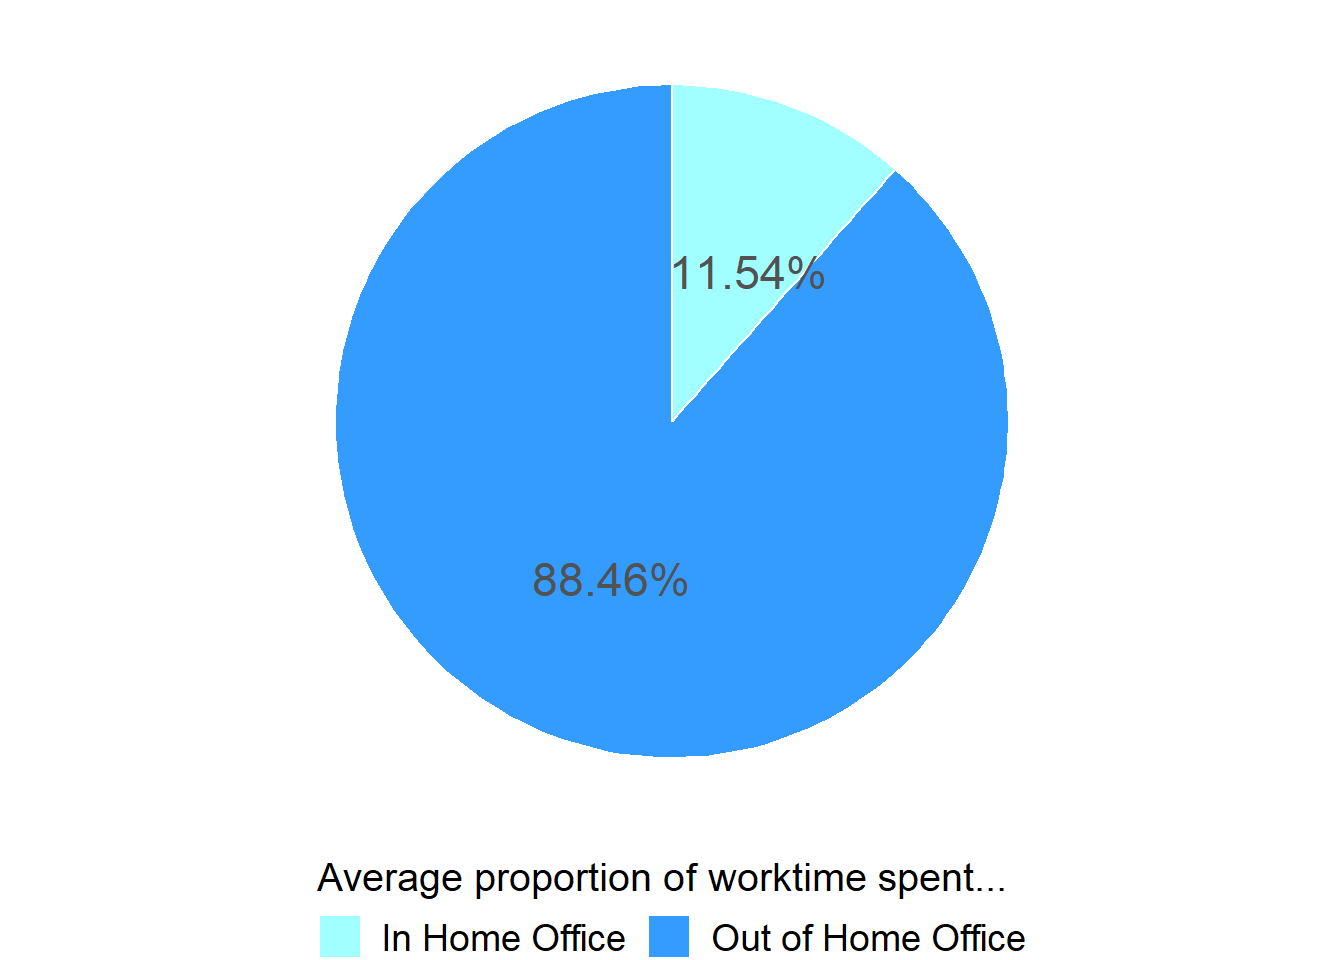
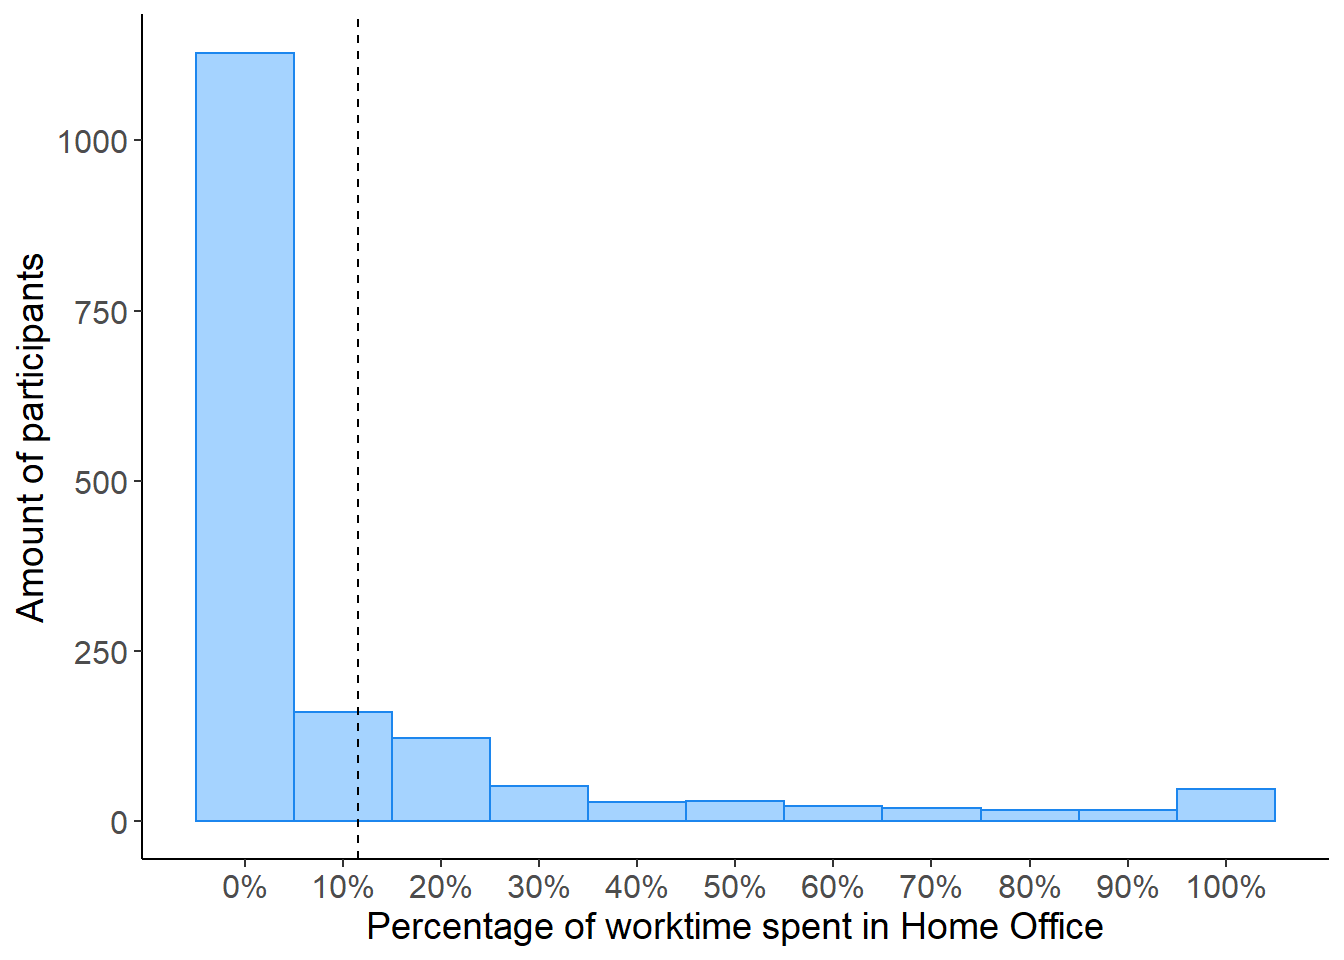
As can be seen, before the COVID-19 Crisis hit, work from home was rather sparse. Only 725 of the 1639 participants, who answered this question, had indicated that they worked from home at all (equalling 44.23%)