Analysis
library(DT)
library(readr)
library(plotly)
library(htmltools)
library(tidyverse)
Example Analysis #1
Last compiled: 2020-10-02 Example text.
Second level header
Example text.
Example R Analysis
dataset <- readr::read_csv("data/data.csv")Example Interactive Table
DT::datatable(dataset,
              rownames = FALSE,
              filter="top",
              options = list(pageLength = 5, scrollX=T) )
Example Plot #1
plot1 <- dataset %>%
  dplyr::filter(Group==1) %>%
  ggplot2::ggplot(., aes(x = Month_Ordered, y = Variable_1)) +
  geom_bar(stat="identity") +
  geom_line() +
  geom_point()

plot1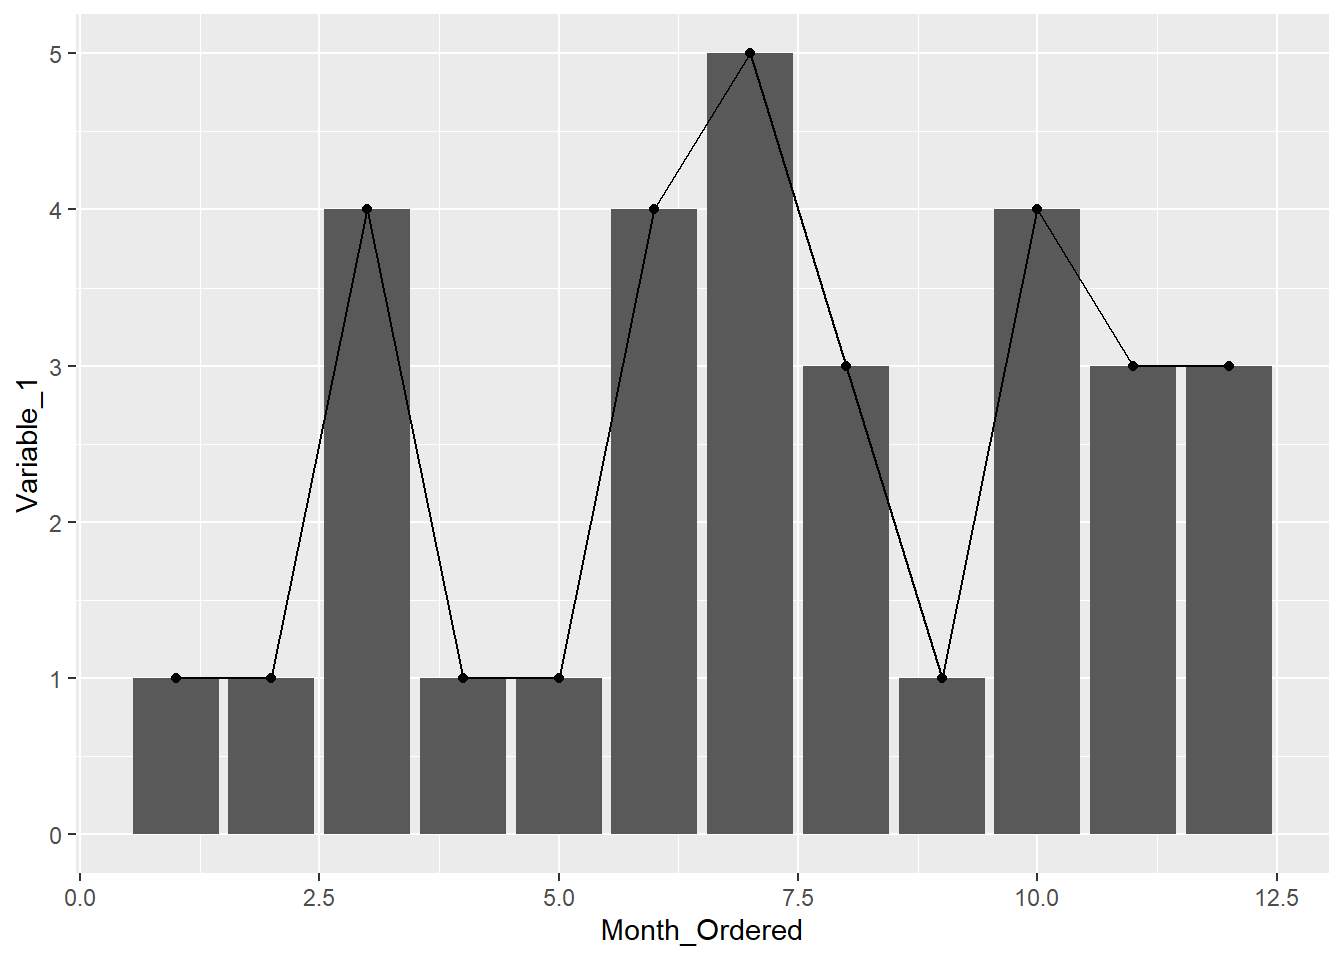
Example Dynamic Plot #1
plotly::ggplotly(plot1)Example Plot #2
dataset$Group<-as.factor(dataset$Group)

plot2<-dataset %>%
  ggplot(aes(x=Month_Ordered, y=Variable_2, group=Group, color=Group)) +
  geom_line() +
  geom_point()

plot2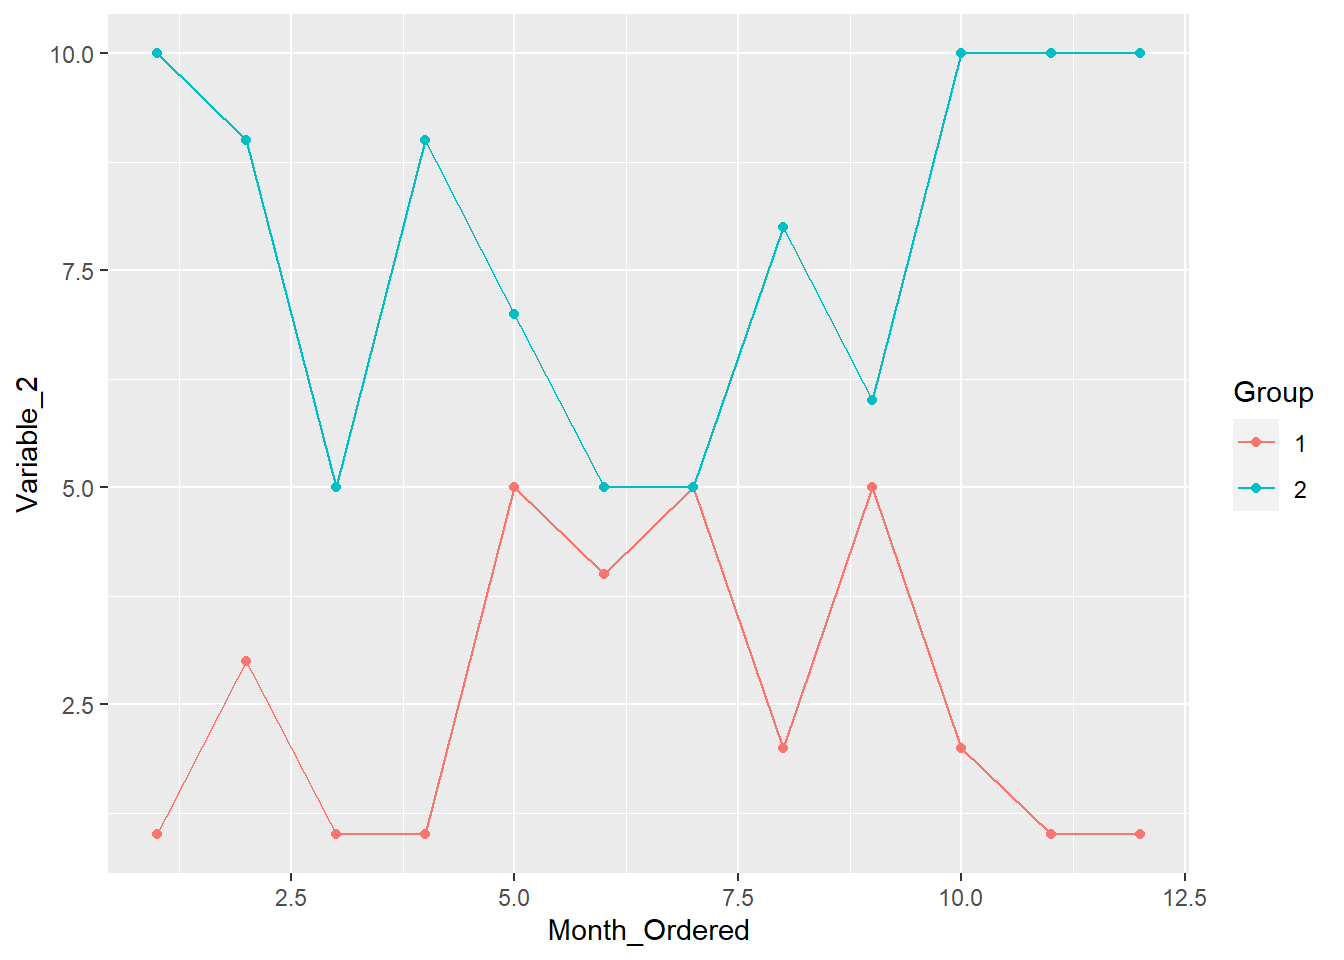
Example Dynamic Plot #2
plotly::ggplotly(plot2)